A while ago we explored the impact of color on video content. We explained how different brightness, saturation, and contrast levels, as well as the perceived color itself, can influence how we feel about a video. We learned how even the smallest adjustments in those settings can affect our mood, energy levels, and, most importantly, our choice of which video streaming app we use.
In this article, we share our experience in developing new approaches and exploring new testing possibilities by looking deeper into perceived image differences, not only between applications but network settings and devices used as well.
One of the most important requirements for testing that ensures an apples-to-apples comparison is maintaining stability and using a standardized approach. Therefore, at TestDevLab we are constantly working on building new solutions to test video content for various products that require video capturing, sharing, streaming, editing, and much more.
A new filming setup solution: LiveLy Box
In video conferencing tests, we mostly capture video media by using our standardized testing environment for audio and video quality testing with a separate desktop display that streams pre-recorded video and which allows us to capture the sent and received video.
But not all video related content can and should be tested the same way. In order to implement new testing approaches we always have to improve and think of new solutions.
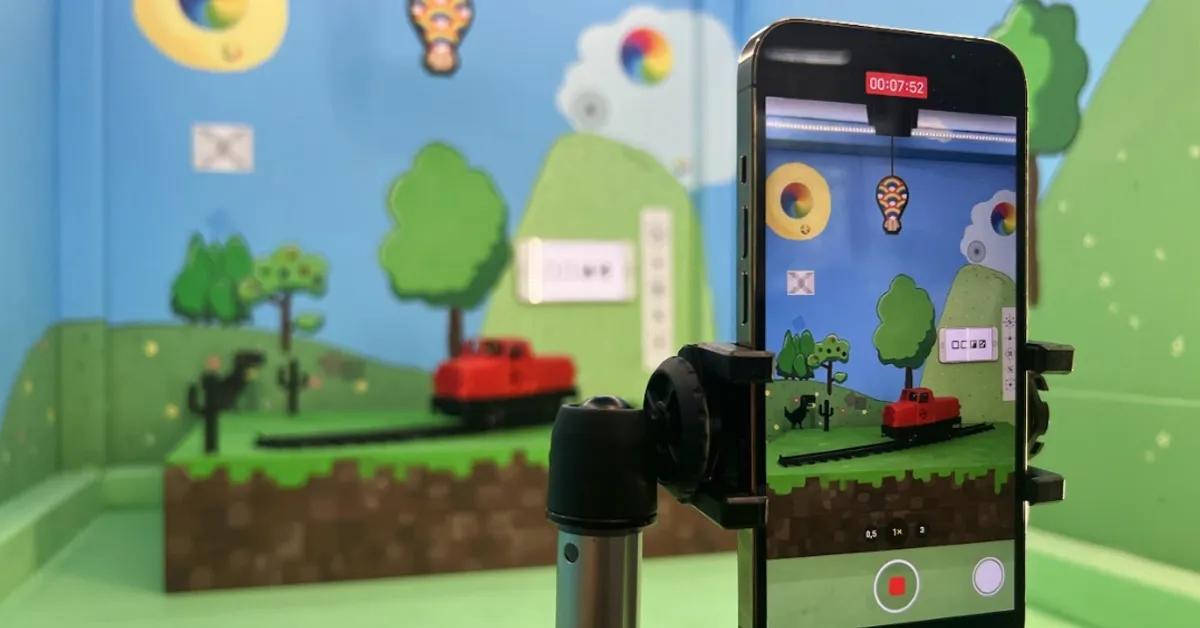
This time we stepped outside the box with our standard filming setup and created a new real-time setup box that allows us to dive even deeper in video quality evaluation, recreating even more realistic scenarios—LiveLy Box.
What is LiveLy Box?
LiveLy Box is a new testing environment that we can describe as a lot more lively than its predecessor with its pitch black insides and predefined video source. Its highly realistic environment is achieved by:
- a custom made scene with different shapes, sizes, and distances, creating realistic depth to the environment;
- a wide range of colors for deeper color-analysis possibilities;
- detailed elements that help evaluate pixel quality changes;
- QR-type markers for video fluidity evaluation;
- radio controlled moving elements that create a realistic moving scene;
- customizable LED lighting that allows playing with light and shadows.

The moving elements
In order to meet all of the requirements for an effective video capturing process, the test team approached the Research & Development department to create the setup. We worked together to come up with a solution of creating a moving object within the test environment that would be in a clear visibility of the test device.
Since we often see video fluidity issues when it comes to fast moving elements, the idea was to have an element swinging across the frame backwards and forwards. We previously used the same solution that our specialists used to test fitness apps, but the tests showed that a more standardized solution would do the trick best. Therefore, we decided to switch to side-to-side swinging motions for the setup. We added a servo motor into the setup and a colorful printed model, swinging across the frame to represent a constant fast moving object that would create a motion blur.

Considering the idea with the swinging model was good, our team went even further by coming up with a 3D-printed train model, controlled by radio transmitter and powered by batteries on board. This model introduced more movement into the frame, serving as a constant variable that all cameras that were tested would capture.

The setup was easy to control since it required just one push of a button for the whole setup to start moving. The preconditions for testing required that the objects in the frame move exactly the same in each test and for each device used.
The scene

Now that we had moving objects capable of creating constant motion, as well as fast moving movements to add more visible motion blur, we needed to add colors to the box. We painted the box to create a scenic view with different details to enhance the visibility of video degradations under various conditions. The box also has detailed elements that help to detect changes in pixel quality and a color wheel for RGB analysis.
To maintain consistent light conditions and add shadows, LED lighting is used. The benefit of this lighting setup is that the box can be customized to have cold or warm lighting. Additionally, the brightness can be dimmed to recreate different lighting conditions.
For video frame rate detection, the box has a designated display with QR-type markers that create a unique combination of four QR squares for each frame. This solution helps us detect frames per second and video fluidity issues, such as freezes or frame skips.
Another addition for the LiveLy Box was a 3D printed phone stand that allows us to place devices in one constant position for most consistent video capturing.
Using LiveLy Box to test camera quality of short-form video apps
A year ago this method would have brought us a lot of challenges, since video quality metrics usually require the original pre-recorded video so that it can be compared to the uploaded degraded video frame-by-frame. But as you might already know, TestDevLab launched its own new video quality evaluation algorithm called VQTDL. This algorithm can be modified and used to evaluate user perceived video quality of both creator and viewer video without having the original pre-recorded video, even with all the application UI elements surrounding the image, different zoom settings, and different resolutions.
And in addition to video quality, we are diving more into color analysis possibilities, evaluating color changes based on different devices, camera apps and network conditions.
Testing conditions
- To make sure everything works as expected and to get more reliable data and an in-depth understanding of how different conditions affect results, we collected 400 video samples by creating combinations of many factors that can affect the results: different devices, applications, user accounts, network conditions, and many more.
- We chose five popular short-form video applications to test. Let's call them App A, B, C, D and E.
- For this research, we chose to compare how much the quality changes if the creator uses the application provided camera functionality. We filmed our custom-built setup with a back camera from each of the applications, as well as the device's native camera app as a baseline for comparing how much each app varies from the device’s default quality.
Users
In short-form video applications each user can have a different role depending on the actions they choose to do. In this article we will mention two kinds of users:
- Creator. The user who creates (records) the video and then uploads the video to the application.
- Viewer. The user who watches the video uploaded by other users.
To make the investigation as realistic as possible, it is important to divide both of these user groups. This involves using different devices and accounts for both groups to avoid situations where the app provides different quality settings for the creator or saves cached data on the device, which could lead to false results.
Devices
For devices, we used a Samsung S21 Ultra to represent an Android device, and an iPhone 13 Pro Max to represent an iOS device.
To better understand how devices affect the user, both users were tested on both devices. This meant that four combinations of upload>viewing directions were used:
- The creator films and uploads a video from an Android device. Viewer 1 watches the video from an Android device. Viewer 2 watches the video from an iOS device.
- Creator films and uploads a video from an iOS device. Viewer 1 watches the video from an Android device. Viewer 2 watches the video from an iOS device.

Network conditions
For controlled network conditions we used high-speed Wi-Fi (>70Mbps) and low-speed Wi-Fi (1Mbps) to see if the network speed affects how the application handles video content for both creators and viewers. Similar to the scenario with the devices, both users were tested under both conditions, creating 4 possible combinations of upload->viewing directions.

The results
The video samples were collected by filming the LiveLy Box setup using the device's native camera as a baseline, using the video creation functionality on five different short-form video apps, and filming the videos through the app, to compare whether the quality of the camera on the app differs from device's native camera quality. In this investigation we are focusing on RGB histogram analysis to see changes in colors and VQTDL score analysis to see the changes in video quality.
RGB histogram analysis
To get precise RGB histograms that are comparable, we used a color wheel element from the setup and used scripts that detect and crop the element, excluding any variable elements, such as app buttons. After that, the script processes the cropped element and acquires RGB data.
An RGB histogram is a representation of the distribution of colors in an image. The X axis represents a scale of tones where 0 is black and 255 is white. The Y axis represents the number of pixels in an image in a certain area of the tone scale.
It's very important to note that we are looking at the shifts on the X axis to observe tonal changes in color brightness. The amount of pixels on the Y axis can be different. This is caused by different zoom ranges for each application.
Device native camera comparison
Below we can see Android vs. iOS results for RGB histograms, and an example output image from the native camera.


We can see that the Android native camera has more dark blue and green tones, whereas the iOS native camera shows significantly higher light tones for all three colors.
App comparison
What quality does the user get if they choose to film videos directly from the application? Let's take a look at the video playback quality results from the viewer’s side on five different short-form video apps. The results are compared against the creator's native camera.


In the histogram graphs above we can see where network limitations on both creator and viewer devices are high-speed Wi-Fi. To fully describe the results of all platform, application and network condition combinations and compare them to each other, we would need much more than a blog post, however, we can summarize our overall findings from these tests.
When reviewing application results in comparison with the baseline and each other, we can see that different apps have different behaviors.
- Apps A and B in all tests are very similar in behavior.
- In most cases these two apps are the ones that shift to the brighter tones the most in both platforms.
- But there are exceptions when the Android creator device network is limited. In these cases, the histogram shifts to the darker side compared to when the network is unlimited.
- App C modifies video content for sharpness.
- In our result analysis we noticed that when viewing video from an iOS device there are noticeable differences in certain histogram tonal parts compared to all other app histograms.
- We can see that in the histogram there is an increase of pixels with a very dark color tone and with a very light color tone. This is something that we can observe in videos as well, as App C is presumably trying to make content sharper with contrasted borders.
- Evidently this content modification is introducing black and white tone pixels which are used to make content sharper.
- App D is the closest to both platform native cameras.
- This is more noticeable in Android creator device histograms where the shift to the brighter color tones for all apps are more pronounced. In these tests, App D, in most cases, is the closest to the native camera if compared to other apps.
- In iOS this shift to the brighter tones is not so pronounced, but still you can see the similarity with the native camera.
- What differentiates this app is that the second part of the histogram is shifted to the left, showing us that part of the picture has darker tone pixels than the built-in histogram.
- App E histograms have interesting behavior in various networks.
- When the creator device network has low-speed Wi-Fi color tones shift to the darker side compared with high-speed Wi-Fi.
- Apps C and D also have similarities.
- Their behavior in histograms are quite similar in multiple platform and network combinations.
When reviewing results from a platform perspective, we can see that iOS is less sensitive to low-speed Wi-Fi in terms of histogram changes. This means that when creating and uploading video from an iOS device and then viewing this content on both iOS and Android, the changes compared with the iOS baseline tests are low. With some minor exceptions this can be seen in all applications.
If we create and upload video from an Android device and then view it from both iOS and Android devices we can see that depending on network conditions there are various changes in histograms. These changes are mostly color tones shifting to the darker side, but in some apps the shift happens to the other side, making video brighter.
What we can see from all these tests, is that in various device, app, and network conditions, RGB histograms are changing color tones. However, it is also interesting to see that the overall shape of the graph curves does not change. They can be shifted to the brighter or darker side, and have more pixels or less, but they still remain similar to the native cameras’ histogram. Different apps can change color tones but they all are still restricted by device and platform.
VQTDL score analysis
Video Quality Testing with Deep Learning (VQTDL) is a no-reference algorithm for video quality assessment. This solution produces image quality predictions that correlate well with human perception and offers good performance under diverse circumstances, such as various network conditions, platforms and applications.
VQTDL is evaluated using a 5-point scale, where 1 represents bad quality and 5 represents excellent quality.

We can observe how our applications compare with each other and our baseline native cameras.
For reference, these are the VQTDL results for the images captured with the native camera:
- Android - Samsung S21 Ultra: 4.71
- iOS - iPhone 13 Pro Max: 4.80
Below you can see a table with the scores.

1st place: App C
- Stable results in all conditions.
- Best results on iOS viewer device.
2nd place: App D
- Best results on iOS viewer device.
- In conditions where the creator and viewer use an Android device and the viewer has a low-speed network, the VQTDL results are considerably lower.
3rd place: App B
- Stable results in most conditions.
- Best results on Android viewer device.
- In conditions where both the creator and viewer use an iOS device with a low-speed network for the viewer, this app shows lower video quality.
4th place: App A
- Best results on Android viewer device.
- In tests where the viewer has a low-speed network, it shows low scores.
5th place: App E
- Best results on Android viewer device.
- Low results in tests where the viewer device is iOS.
- The lowest results in tests where the viewer device is iOS with a low-speed network.
After analyzing these results, we can see patterns emerging for each application, showing their strengths and weaknesses.
Final thoughts
Thanks to the LiveLy Box we can further explore the differences in media captured directly through the app’s camera functionality, which is supported by continuously improving video quality evaluation metrics, such as VQTDL or RGB color analysis.
When comparing app results, we can see that there are noticeable differences, with each app performing better on a particular platform. Additionally, some apps show consistent performance across both high-speed and low-speed Wi-Fi, while others experience a significant drop in performance under limited network connections. But, of course, there are always more factors to analyze and additional conditions to consider.
If you want to find out more about other useful video quality evaluation metrics, explore the various approaches and solutions we offer, or test your own video solution and compare it against competitors, don't hesitate to reach out and send us a message.


